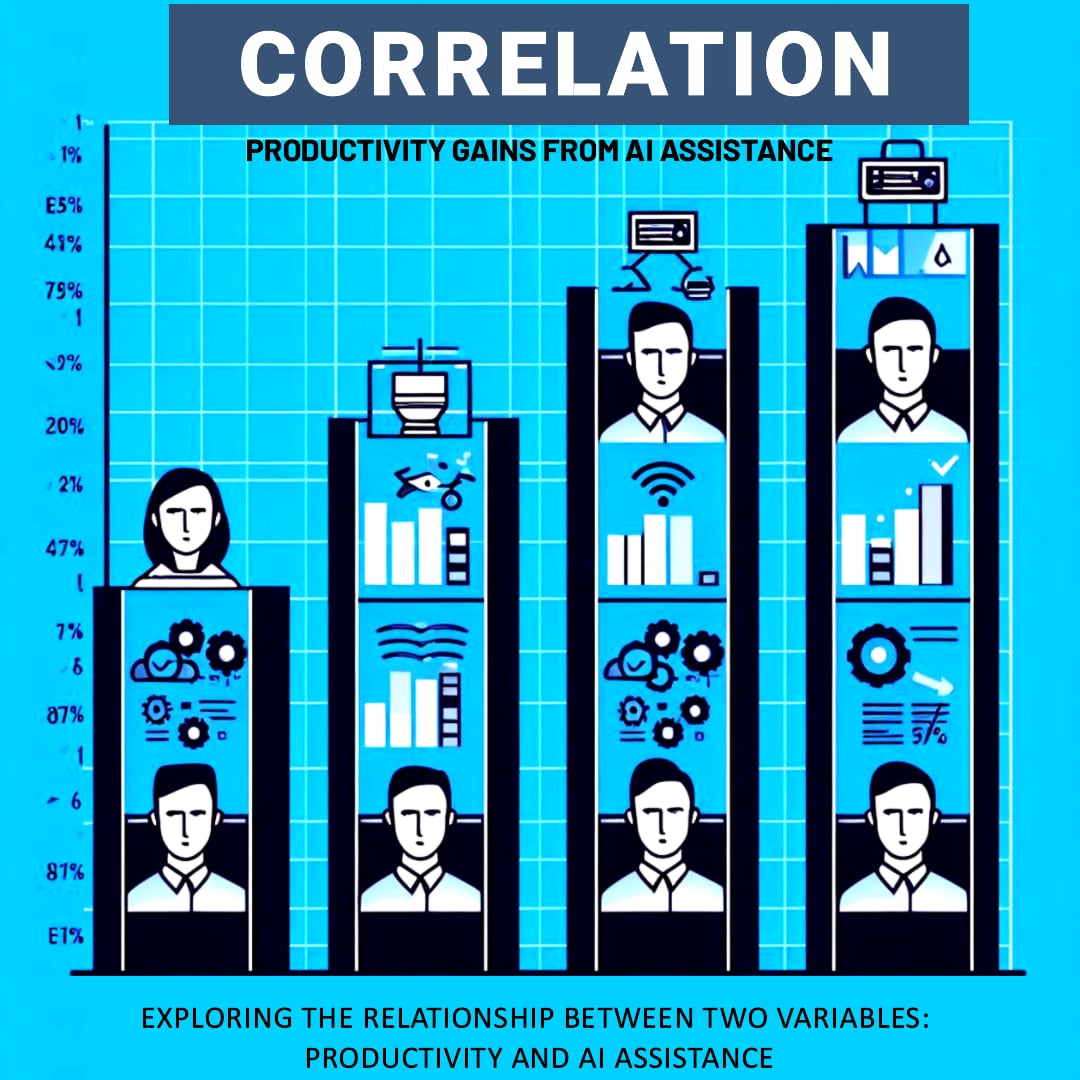
There once was an AI named Chat who was really good at repeating back information it already knew. One day, Chat was given to some office workers [1] to help them with their jobs. Some of the workers were experts at their jobs, while others were still learning.
At first, Chat helped all the workers get more work done faster - even the experts! But soon, the experts noticed something funny. The workers who were still learning got way MORE help from Chat. The new workers improved a lot using Chat, doing their work faster and better than ever before!
The experts wondered why Chat didn't help them as much. That's when they realized - that Chat is an expert at repeating back facts but can't come up with brand new ideas. So, for workers who already knew those facts, Chat didn't offer them that much new help. But for newer workers still learning those basics, Chat was able to teach them so much more!
This shows a correlation - as in, two things that relate to each other and change together. The more expert a worker already was, the less helpful Chat was for them. But for newer workers, Chat could help them almost as much as the experts! It's because of their different starting points. Chat has a limit to how expert it can be. So, the closer a worker already was to Chat's expertise, the less new stuff Chat offered them.
The experts and newbies improved at different rates thanks to Chat. Their own expertise compared to Chat's matters for how much more they can learn. That connection in how much they improve is the correlation!
The SDTEST® gives clues to someone's motivational values. However, additional polls can provide more pieces of the puzzle.
Imagine also giving an "A.I. and the end of civilization" poll. It asks people to rate at the agree or disagree level.
Now imagine 100 people who took both tests. You could match up each person's SDTEST® colors with their rated answers about the danger of AI.
Comparing tests gives an expanded picture of values in action. More puzzle pieces make the whole image more apparent!
Multiple tests can work together, like colors blending on a palette. Other polls reveal what engages your values, like what is the perception of the danger of AI. Combined, they paint a richer picture of what motivates our thoughts and deeds.
Below you can read an abridged version of the results of our VUCA poll “A.I. and the end of civilization“. The full results of the poll are available for free in the FAQ section after login or registration.
| Питання опитування |
Всі питання
Всі питання 1) Безпека (скільки ви погоджуєтесь чи не погоджуєтесь?) 2) Контроль (скільки ви погоджуєтесь чи не погоджуєтесь?) |
|||||
| Розподіл |
|
|||||
| Нормальний |
|
|||||
| Нормальний |
|
|||||
| Нормальний |
|
|||||
| Нормальний |
|
|||||
| Нормальний |
|
|||||
| Нормальний |
|
|||||
| Нормальний |
|
|||||

[1] https://www.ft.com/content/b2928076-5c52-43e9-8872-08fda2aa2fcf
