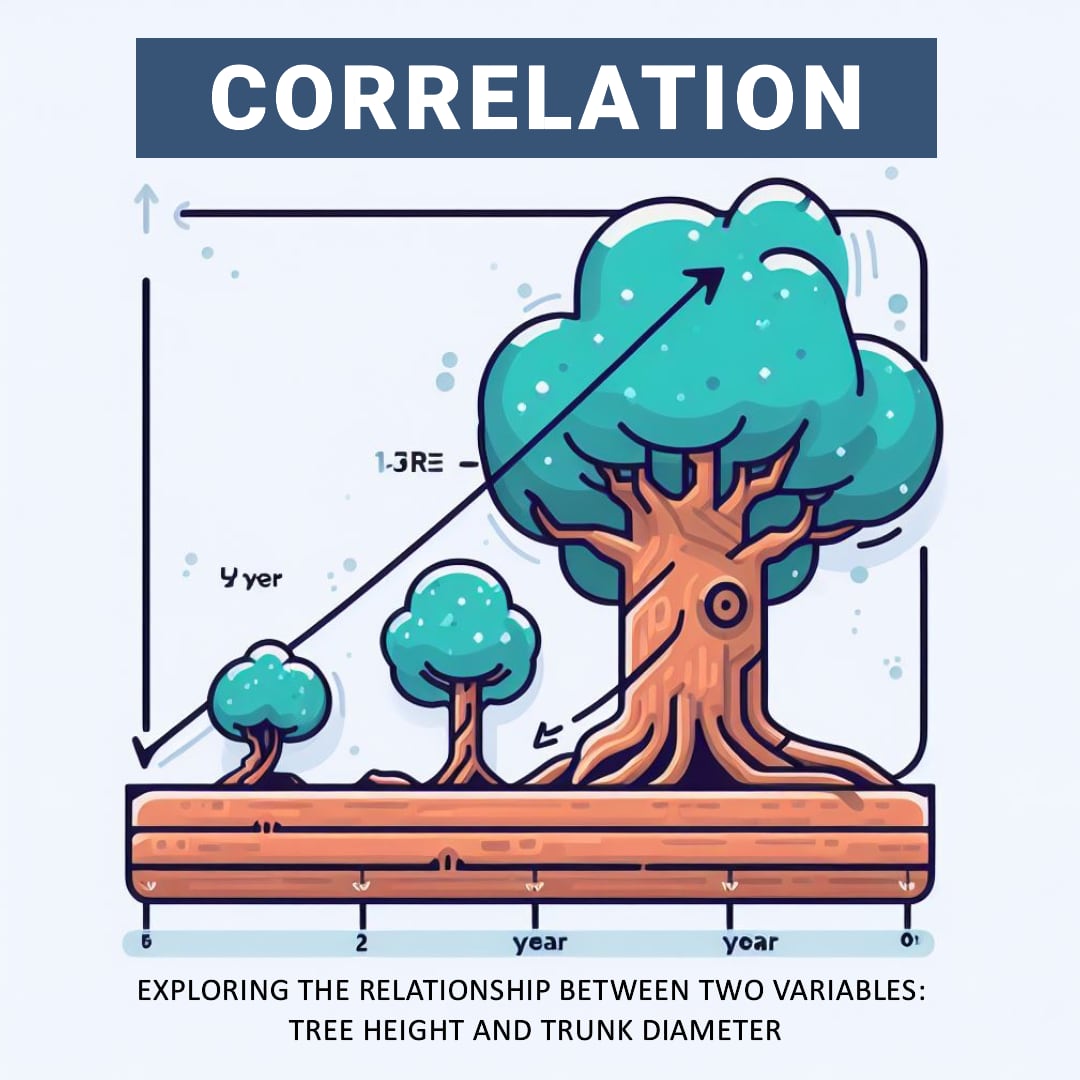
Once upon a time, there was a tiny oak tree sapling named Peety. Peety dreamed of growing up into a mighty oak tree.
Each year, Peety grew a little bit taller. He stretched his branches toward the sun and felt his trunk thicken as he grew.
Over many years, Peety grew from a sapling into a young tree and finally into a tall, mature oak! He was so tall that he could see over the whole forest.
Peety noticed that the other tall oak trees had thick trunks, too. His friend Paul reached high into the sky just like Peety. Paul's trunk was thick and sturdy at the base.
The small saplings that were sprouting had skinny little trunks. But Peety knew that would change over time as they grew taller.
Peety realized that, just like him, the taller an oak tree was, the thicker its trunk became.
So even though the forest was filled with all different sizes of oak trees, Peety noticed a pattern - a correlation between tree height and trunk width. The tall trees always had thicker trunks, while the small saplings had skinny trunks. This was how pine trees grew strong enough to reach great heights!
If you record how a tree grows - its height and trunk thickness - and plot it on a picture or graph, then the correlation is when these two things change together. That is, if you see that one is increasing, the other is also increasing, and vice versa.
The SDTEST® gives clues to someone's motivational values. However, additional polls can provide more pieces of the puzzle.
Imagine also giving a "Fears" poll. It asks people to rate different fears from 0 (not scary) to 5 (very scary).
Now imagine 100 people who took both tests. You could match up each person's SDTEST® colors with their rated fears.
If people high in Blue values feared uncertainty more, that insight ties values to perceptions. Blue people may resist change more.
Or if Orange achievers feared failure most, that reveals their drive. They may overwork to avoid mistakes.
Comparing tests gives an expanded picture of values in action. More puzzle pieces make the whole image more apparent!
Multiple tests can work together, like colors blending on a palette. Other polls reveal what engages your values, like how your hobbies show what activities you enjoy most. Combined, they paint a richer picture of what motivates our thoughts and deeds.
Below you can read an abridged version of the results of our VUCA poll “Fears“. The full results of our VUCA poll “Fears“ are available for free in the FAQ section after login or registration.
| سوالات نظرسنجی |
تمام س questions الات
تمام س questions الات بزرگترین ترس من این است |
|||
| توزیع |
|
|||
| طبیعی |
|
|||
| طبیعی |
|
|||
| طبیعی |
|
|||
| طبیعی |
|
|||
| طبیعی |
|
|||
| غیرعادی |
|
|||
| طبیعی |
|
|||

